Observability Theater: How Enterprise Monitoring Stacks Create the Illusion of Insight
The Dashboard Paradox
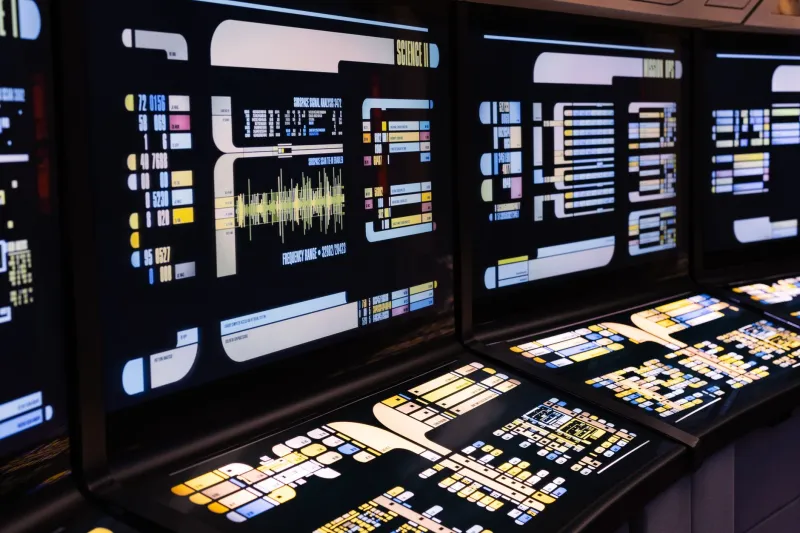
Walk into any enterprise operations center and you will likely find walls of monitors displaying colorful graphs, alert counters, and service health indicators. At first glance, it looks like mastery. In practice, it frequently represents something far more troubling: the organized appearance of control without the substance behind it.
This is observability theater — a condition in which enterprises accumulate monitoring tools, generate enormous volumes of telemetry data, and still find themselves blindsided by cascading failures, degraded user experiences, and architectural decisions made on faulty intelligence. The investment is real. The insight is not.
For enterprise engineering and IT leadership, this distinction matters enormously. When observability data cannot be trusted, every architectural decision downstream inherits that uncertainty. Capacity planning, incident response, vendor negotiations, and even board-level risk assessments rest on a foundation that may be far less stable than it appears.
Why Siloed Telemetry Becomes Structural Noise
The root cause of most observability failures at enterprise scale is not a lack of data. It is an excess of disconnected data generated by tools that were never designed to speak to one another.
A typical large enterprise might operate separate platforms for infrastructure metrics, application performance monitoring, log aggregation, distributed tracing, synthetic monitoring, and network observability. Each tool was likely procured independently, often by different teams with different mandates. The result is a collection of local truths that frequently contradict one another — or worse, tell plausible but incomplete stories that lead engineers toward the wrong conclusions.
Consider a scenario common in US financial services and healthcare technology environments: an application performance monitor reports healthy response times while a downstream log aggregator quietly records a rising error rate on a rarely-monitored service dependency. Neither signal, viewed in isolation, triggers an alert threshold. Together, they describe an imminent failure. Without correlation infrastructure connecting the two data streams, the combined signal never forms.
This is not a tooling problem. It is an architectural problem masquerading as a tooling problem — and that distinction determines whether the solution costs thousands of dollars or millions.
Alert Fatigue as Organizational Debt
Siloed telemetry produces another compounding liability: alert fatigue. When monitoring systems are configured independently, threshold tuning happens independently as well. Teams calibrate alerts to their own tolerances, their own service boundaries, and their own historical baselines. The enterprise-wide result is an alert volume that no on-call rotation can meaningfully process.
Research from incident management platforms consistently shows that high-volume alert environments produce slower mean time to detection, not faster. Engineers learn to discount alerts. Automation is built to suppress rather than investigate. The monitoring infrastructure, originally designed to surface problems, gradually trains the organization to ignore it.
For enterprise IT leadership, alert fatigue should be understood as a form of organizational debt — an accumulation of deferred decisions about signal quality that eventually extracts a cost measured in outage duration, customer impact, and engineering morale. Addressing it requires deliberate architectural intervention, not simply tightening thresholds or adding suppression rules.
Auditing Your Observability Architecture
Before an enterprise can rebuild toward trustworthy observability, it must first understand where its current architecture fails. A structured audit should examine several dimensions.
Signal coverage and gap mapping. Begin by charting every component of your production environment against the telemetry it currently generates. Distributed systems — particularly those involving third-party SaaS integrations, managed cloud services, or legacy on-premises infrastructure — frequently contain significant blind spots that no dashboard reflects because no data is being collected in the first place.
Correlation capability. Assess whether your current tooling supports cross-signal correlation at query time. The ability to pivot from a spike in infrastructure metrics to related application traces to relevant log entries within a single investigation workflow is foundational. If engineers must manually switch between three separate platforms and mentally reconcile timestamps, your observability architecture is adding latency to every incident.
Baseline reliability. Examine whether your alerting thresholds and health indicators are derived from statistically meaningful baselines or from initial configuration defaults that were never revisited. Default thresholds configured at deployment time rarely reflect actual production behavior after six months of load pattern evolution.
Vendor dependency concentration. Map which elements of your observability stack are tightly coupled to a single vendor's proprietary data format or query language. Vendor lock-in within monitoring infrastructure is particularly insidious because it constrains architectural flexibility precisely when you need it most — during rapid incident response or platform migration.
Building Toward Trustworthy Intelligence
Reforming enterprise observability architecture is not a rip-and-replace exercise. It is an incremental discipline that begins with establishing shared standards for telemetry instrumentation across service teams.
Adopting open instrumentation standards — such as the OpenTelemetry project — allows enterprises to decouple data collection from data storage and analysis. This separation is strategically significant: it preserves the option to change backend platforms without re-instrumenting every service, and it creates a common data schema that enables correlation across previously siloed signals.
Enterprise teams should also invest in establishing a unified observability data plane — a layer responsible for ingesting, normalizing, and routing telemetry from all sources before it reaches any analysis or alerting system. This architectural pattern does not eliminate specialized tooling. It ensures that specialized tools are working from the same underlying data rather than competing interpretations of system state.
Finally, observability governance deserves the same organizational attention that data governance receives in mature enterprises. Defining ownership of signal quality, establishing standards for instrumentation coverage, and creating feedback loops between incident retrospectives and monitoring configuration are practices that transform observability from a passive infrastructure concern into an active engineering capability.
The Architectural Decision Risk No One Is Measuring
Perhaps the most consequential cost of unreliable observability is one that rarely appears in post-incident reviews: the architectural decisions that were made on the basis of misleading telemetry.
When capacity planning relies on metrics that do not accurately represent actual resource contention, infrastructure is either over-provisioned at unnecessary cost or under-provisioned ahead of failure. When service dependency health is inferred from incomplete signals, refactoring decisions and API contract changes carry hidden risk. When security teams rely on observability data to detect anomalous behavior, gaps in coverage become gaps in threat detection.
For enterprise CTOs and enterprise architects, the question is not whether your organization has an observability stack. It is whether that stack is generating intelligence you can actually trust — and whether the decisions being made on its basis reflect the reality of your systems or the theater of your dashboards.