Green Pipelines, Red Ink: The Metrics That Make Enterprise Deployments Look Healthier Than They Are
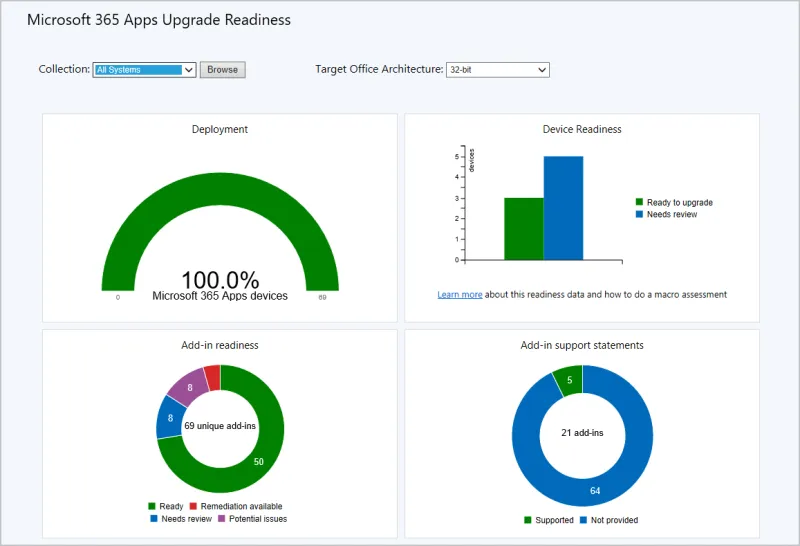
Photo: software deployment dashboard green status screens office, via learn.microsoft.com
Walk into the delivery organization of any Fortune 500 company and you will likely encounter a wall-mounted dashboard: build success rates hovering in the high nineties, deployment frequency trending upward, cycle time measured in days rather than weeks. By every metric the pipeline reports, the organization is executing flawlessly. Yet the incident queue tells a different story—one of Friday-night rollbacks, emergency patches, and customer-facing outages that no amount of green checkmarks seemed to anticipate.
This disconnect is not a tooling problem. It is a measurement philosophy problem, and it is costing US enterprises far more than most budget owners realize.
The Audit Trap
Enterprise CI/CD pipelines are frequently designed by committee, shaped by compliance requirements, security review boards, and change advisory processes that evolved over a decade. The result is a pipeline optimized to prove correctness rather than to achieve it. Every artifact is signed. Every approval is logged. Every stage gate is documented for the auditor who arrives each October.
None of this guarantees the code works. A pipeline can satisfy SOX evidence requirements while routinely shipping regressions, because the signals it collects—build duration, test pass rate, approval chain completeness—measure the process of deployment, not the consequence of deployment. An organization can pass every audit and still ship broken software, and in many cases the audit discipline actively obscures that fact by creating confidence where none is warranted.
Vanity Metrics in a Delivery Costume
Consider the metrics most enterprise delivery dashboards celebrate:
- Build success rate. Easily gamed by retry logic and flaky-test quarantine. A 98% pass rate may simply mean the team has automated the act of hiding instability.
- Deployment frequency. Deploying forty times a day is meaningless if a third of those deployments are hotfixes correcting the previous one.
- Lead time to production. Code that reaches production quickly but fails there has simply relocated the delay.
- Test coverage percentage. Coverage measures that code executes during testing, not that meaningful behavior is asserted. A 70% coverage figure on an enterprise monolith frequently certifies little beyond the existence of the test suite.
These numbers are attractive precisely because they are cheap to collect and easy to chart. But they share a structural flaw: they all describe the pipeline's internal state. None of them reaches outside the toolchain to ask whether customers, revenue, or operations were affected.
What Actually Predicts Production Pain
Organizations that have closed this gap tend to measure a different family of signals. Change failure rate—the percentage of deployments that require remediation—correlates far more strongly with real delivery health than any pipeline statistic. Deployment-to-incident latency reveals how long problems fester before anyone notices. Rollback frequency, broken down by service and by team, exposes precisely where quality debt is concentrated.
More advanced organizations tie deployments directly to business telemetry. If a release to the payments service coincides with a spike in abandoned checkout sessions, no test pass rate will compensate for that signal being invisible. The most useful dashboard in the enterprise is often not the DevOps toolchain at all—it is the intersection of deployment events with the product analytics and support-ticket streams that reflect actual customer experience.
Reorienting Without Rebuilding
The good news is that correcting this does not require replacing the pipeline. It requires reframing what leadership asks of it.
First, elevate change failure rate to a first-class executive metric, reported alongside deployment frequency rather than buried in engineering reviews. The DORA research framework popularized this pairing for good reason: frequency without stability is just churn.
Second, instrument post-deployment verification. Automated smoke tests against production, synthetic transactions through critical user journeys, and automatic canary analysis convert the minutes after a deployment into a measured stage rather than a leap of faith.
Third, hold retrospectives on deployments that passed every gate and still failed. These are the most instructive failures an enterprise owns, because they expose exactly which signals the pipeline cannot see. Treat each one as a requirements document for the next monitoring investment.
Finally, resist the temptation to centralize all of this into another compliance regime. The moment these metrics become audit checkboxes, teams will optimize for the numbers again, and the cycle repeats. The goal is a feedback loop, not a report card.
The Bottom Line
A pipeline that passes every audit is table stakes, not evidence of quality. US enterprises that continue to steer delivery organizations by internal pipeline metrics are navigating by instruments that cannot detect the terrain ahead. The organizations pulling ahead in 2025 are the ones measuring what happens after the deployment completes—because that is where the customer, and the cost, actually lives.